
Comfort Levels Experiment or Challenge
Watch this video to give context to this activity.
Part 1 – create your own plot of this graphic with the temperatures and humidity of where you live
Part 2 – use your own chart:
- Using your weather station, measure the temperature and relative humidity in as many rooms as possible.
- Plot your findings on your Comfort Level chart
- Which room are you most comfortable in?
- Are you a “winter” or a “summer” person, based on your choice of room?
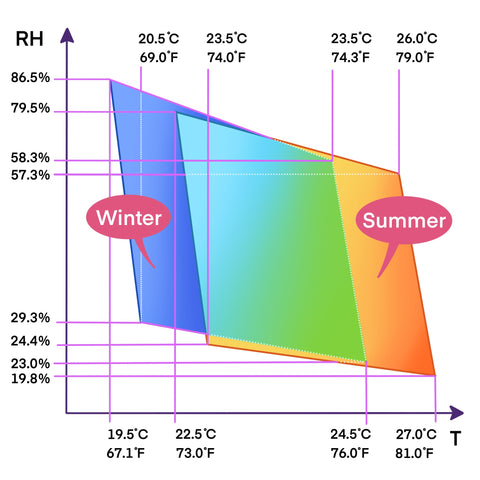
The above chart is for Hawaii
Our Partners
Changing the world isn't easy, and we couldn't do it alone.
A core value of MaxIQ is to be able to provide our educational resources to students around the globe, especially those who live in areas where there is a lack of educational infrastructure to support these young minds in achieving their full potential. MaxIQ wouldn't be able to fulfil our mission without support from...
![]()


![]()